Fewer Costs, More Revenue / Power BI Reporting in the Company
The current economic situation is forcing rapid changes for doing business across virtually every industry. Both business owners and entrepreneurs are currently focusing on strict cost control and looking for space to generate additional revenues.
In these difficult circumstances, advanced analytical tools – specifically business intelligence systems (BI) – can help. Thanks to their extensive data visualizations, modern BI tools such as Microsoft Power BI can be particularly useful at times when you want (or need) to easily gain access to actionable insights on the current state of the company and better respond to changes; something that is incredibly useful in times of high market fluctuation.
What is Business Intelligence Reporting?
Business intelligence reporting refers to the process of analyzing data from various sources to gain business insights into key performance indicators (KPIs) such as revenue, sales volume, and customer satisfaction. This complex data is then presented in visual reports and interactive dashboards, so the company can make informed business decisions that can improve their business operations and bottom line.
Business intelligence reporting tools can also help companies identify trends and patterns in their present data, monitor their business performance over time with historical data, and take action to address any issues that arise. Overall, BI reporting tools can provide businesses with valuable insights into their operations and performance, helping them achieve their goals and build a data-driven culture in the company.
There are many popular Business Intelligence reporting tools, including Microsoft Power BI, Tableau, QlikView, SAP BusinessObjects, IBM Cognos Analytics, and Oracle BI. Each BI reporting tool has its own strengths and weaknesses, and the choice of BI software will depend on the specific needs and requirements of the business. However, Microsoft Power BI is a particularly popular choice due to its ease of use, affordability, and integration with other Microsoft products.
In this article, we’ll be focusing on the one of the most popular tool for data analysis and BI reporting process – Power BI. We’ll show you how to gain access to knowledge about your company’s current state, and better respond to changes – something that can be beneficial in times of high market fluctuation. Business intelligence reports that present changes in shopping behavior over time or using event notification functions, for example, can be incredibly helpful.
1 / Analyzing Sales Trends in Power BI
Sudden changes in the market can lead to changes in customer purchasing patterns. Goods that have sold well so far do not necessarily have to follow the same trend yet, on the other hand, goods that had low customer interest can now achieve much better results. Such situations can force you to temporarily change your approach to target customer groups and change the style in which we stock our warehouses.
You can use Power BI to create data visualization of your revenue, sales volume, and other key metrics. This BI reporting tool provides a range of options for analyzing data, including filters, slicers, and drill-down capabilities. Such a business intelligence report can be used to dig deeper into your sales data and identify trends and patterns.
Here’s an example of the report that helps you keep track of product group sales, particularly in comparison to the historical data, previous week, month or year or even the same period last year. Thanks to such comparisons, you can quickly identify a product or category of goods with an observable and significant increase or decrease in popularity. What’s more, you can verify whether this is the result of the current situation, which is rather exceptional, or if it’s a trend that can be identified every year or month.

The tracking and measuring of these changes with BI reports allow you to quickly detect the phenomena described above without having to delve into each product individually.
2/ Analyzing Distribution Channels in Power BI
Distribution channels are an essential aspect of any business and analyzing them can provide valuable insights into your sales performance. In addition to opening new physical outlets, an e-commerce platform is a good way to increase your reach (in fact, the crisis caused by pandemic and war has shown the latter to be a necessity when the former isn’t an option).
The effectiveness of direct sales and e-commerce activity can be compared by analyzing the relationship between them. You can track changes in sale values over time and adapt the business model by moving sales of given products (or their respective segments) to physical or online stores, based on where the best revenue opportunities have been noted.

Another approach is to analyze the performance of individual distribution channels over time. For example, you could create a report that shows sales performance by channel over the past year. This can help you identify which channels are growing or declining in importance and adjust your strategy accordingly.
It’s also important to consider the relationship between distribution channels and other relevant metrics, such as revenue and customer satisfaction. By analyzing these metrics in conjunction with your distribution channels, you can gain a more complete understanding of your sales performance.
3 / Optimizing Maintenance Costs with what-if Simulations in Power BI
For service companies, it’s typically worth monitoring the profitability of their various branches. While the industry determines the times when the premises (and thus the service) are open and available to customers, other external factors force additional changes – traffic, for example, can influence the number of employees required to handle increasing or decreasing orders.
In each industry, there are also certain fixed costs that are incurred, regardless of the volume of goods or services sold. Rent and maintenance costs are perfect examples. However, this type of information is often scattered across various registers and accounting systems, making it difficult to accurately estimate each location’s profitability.
Fortunately, Power BI is great for solving this, as it can analyze these types of cases through easy-to-use data visualizations that are automatically refreshed, utilizing current information from various data sources. In other words, you can get the clear, complete and conclusive view of each location, with all cost-associated factors.

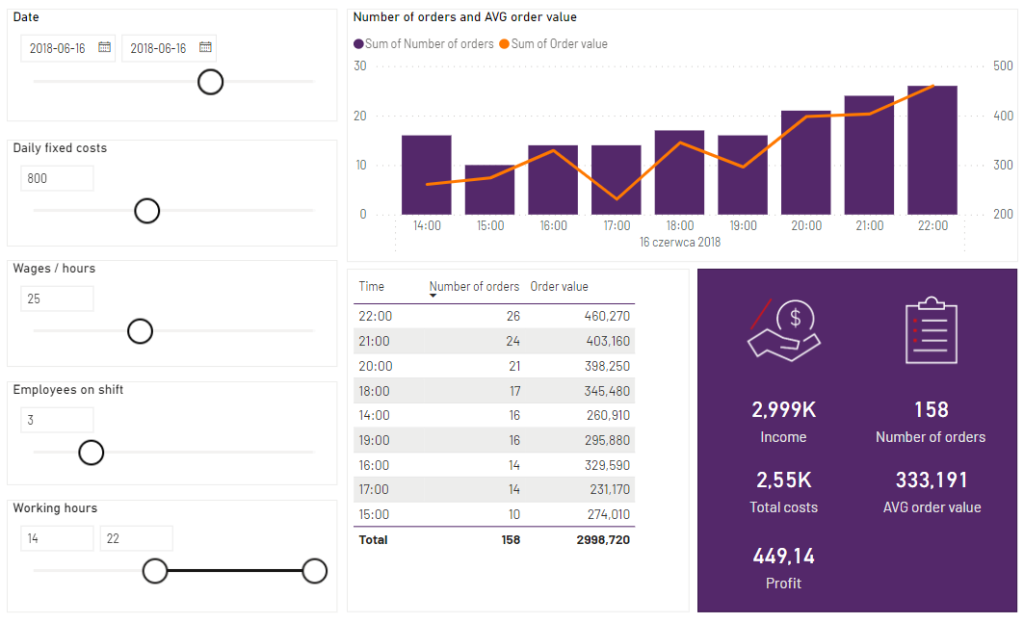
Based on this data, you can create BI reports that illustrate the hours of transactions and their value. Then, you can compare them with the revenue acquired in given days or hours, analyzing the level of profitability. Based on this sample data analysis, you can decide whether it’s profitable to accept orders at given times. Since some costs occurre anyway (such as rent) but others will be diminished if you don’t operate at that time (for example, utility costs, staff salaries etc.), you can determine the most fiscally beneficial course of action.
Further to this, we can also conduct an analysis to project how the company’s financial results will change if we alter the parameters that we can influence, such as the number of employees or working hours.
4 / Receive Notifications of Critical Events
One of the useful features of Power Bi is the ability to receive notifications of critical events. This can be incredibly helpful in enabling organizations to react to changes quickly and make data-driven decisions. For example, if revenues fall below costs, you can set up a notification to alert you immediately, so you can take corrective action. By integrating Power BI with the Power Automate service, you can also define business events that can trigger warning actions, allowing for proactive responses to potential issues.

Common Pitfalls when Analyzing Data in Power BI
Business intelligence platforms are essential if you want to build a data-driven culture in your organization. But be careful! Shiny and colorful charts (especially pie charts 😉) don’t always lead to the right conclusions and informed decisions. In fact, there are some common pitfalls to avoid when analyzing data in Power BI.
Incomplete or incorrect data
Ensure that multiple data sources the data you use in your reporting tool is complete and accurate. Make sure you’re managing data properly and have a single source of truth in your company. Incorrect or incomplete data can skew your analysis and lead to incorrect conclusions. So, before building dashboards, put some work into data preparation.
Overcomplicating visuals
While it is important to customize your visuals, it is equally important to keep them simple and easy to understand. Overly complicated visuals can be confusing and unhelpful.

Not considering context
Context is important when analyzing and presenting data. Simply showing EVERYTHING to EVERYONE won’t be very helpful. Choose relevant information to present (for example the ones we suggested in this article ;)), specify your internal stakeholders for whom these BI reports will help make informed business decisions.
Not using the right visualizations
Power BI offers a wide range of visualizations-simple text, clean tables, heat maps, bar charts, and more. It is important to choose the right visualization to tell your data story. And by the right one, we mean the one that is easiest for your audience to read, especially non-technical users, and that gets to the heart of the data you want to present.
Closing Thoughts
Business Intelligence reporting tools make it easier to draw conclusions from the data generated as a result of the multitude of business events occurring in the company. One of the biggest advantages is the ability to collate data that comes from a variety of specialized sources and see the complexity in an understandable way. This enables you to see phenomena that, if analyzed separately, may have gone unnoticed and, thus, you can discover new sales opportunities or sources of unnecessary costs.
Every year, corporate data becomes an increasingly valuable resource – often referred to as the “new oil” for business. Proper data collection, data analysis, and data reporting are now key to staying competitive in the market.
Looking for a way to better analyze your business data?


