Business Intelligence
A simple way to make complex analyses – use modern systems to report and visualize your data.
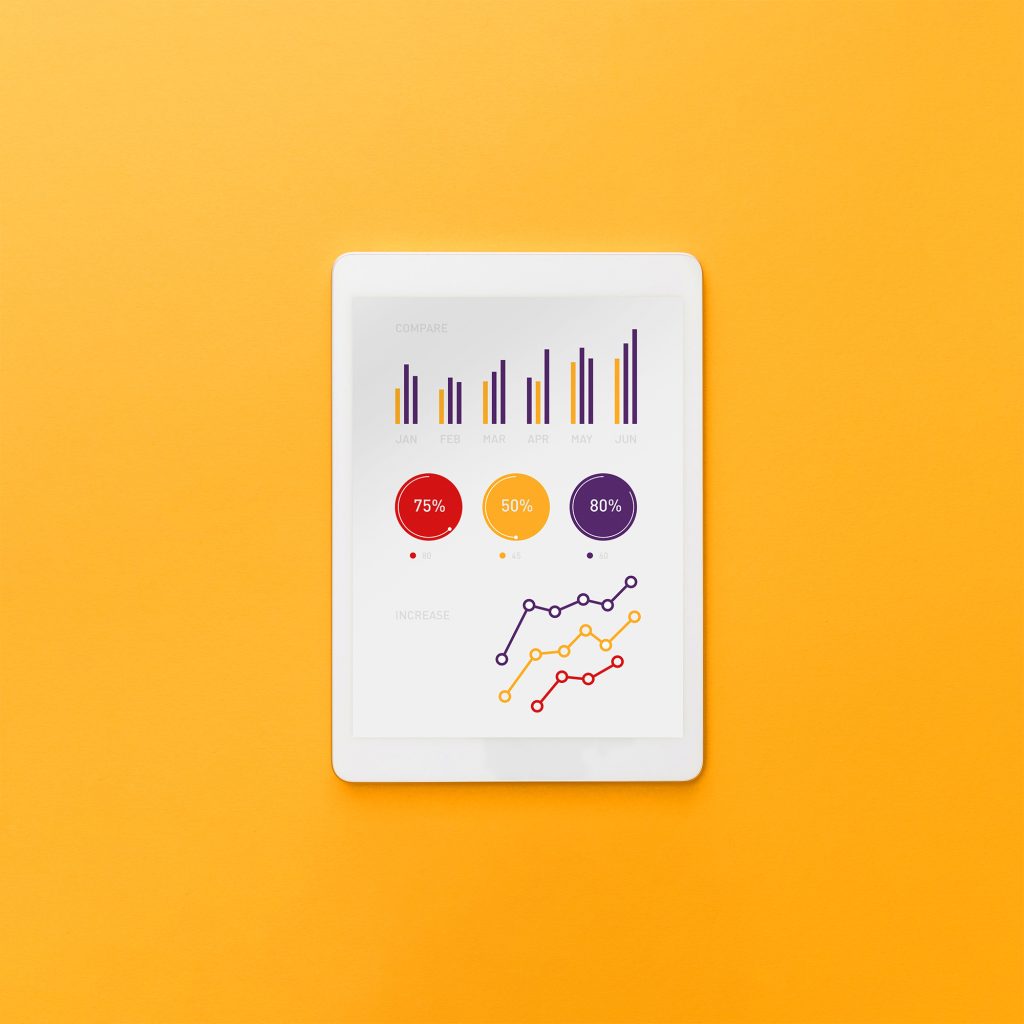
With dedicated, custom dashboards, we can turn Business intelligence tools into visual analytical dashboards that are easy to read and streamline all required data and insights.
Unlimited data visualization capabilities
The variety of reports, tables, and charts available allows you to tailor the presentation of your data to individual needs and expectations.
Multidimensional analysis
Analyze data from multiple perspectives and easily deepen your analysis as you move on to the next levels of detail.
Ready-made dashboards and reports
Create custom dashboards and reports to instantly gain insights in any area, from user engagement and conversions to process and financial health. Share with others, add additional analysis and more, as needed.
Mobility
Enjoy access to reports and analytics platforms from anywhere, and on any device. Both in-app or in-browser.
Manage access and roles
Grant permissions and manage access for different groups of users. Increase the use of data by the right people across your organization, without multiple datasets or duplicate reporting.
Data security
Monitor and secure data, control access to reports, data, and analytics by managing user permissions in your organization.
Make informed decisions based on your data with Business Intelligence
Business Intelligence (BI) tools enable you to create user-friendly dashboards, as well as reports, tables, charts and other interactive forms of data visualization. They allow the integration, processing and transformation of huge data sets from a variety of sources into valuable information.
The right business analysis tools provide real-time insights into your data. Clear and easy-to-understand visualizations ensure faster and more informed decision-making. Our BI tools enable companies to identify trends, opportunities and challenges. Advanced analytics provide a deeper understanding of your customers and optimize operations such as budgeting, planning, sales and cost accounting.
With customizable reports, interactive elements and real-time updates, data presentation becomes child's play, improving communication and understanding within the organization. Consequently, the use of BI and data visualization tools enables more effective management of your business at both the strategic and operational levels.
Let's talk about rolling out BI in your company!
Explore other solutions
/ Data Analytics & Machine Learning
-
Predictive analysis
Predictive analysis, based on historical data, will enable you to detect repetitive patterns, thanks to which you will better understand customer behaviour and effectively predict future events. Automate the decision-making process at the operational level and increase the efficiency of activities.
-
Dynamic pricing & analysis
Adjust the level of prices and discounts for products to individual customer segments. This will improve your competitiveness and optimize the level of sales and margins.
-
Recommendation Engines
Create a personalized product offer. Increase the value of your shopping cart and create a better shopping experience for your customers to guarantee their loyalty.
-
Sales & demand forecasts
Make predictions that mirror actual demand, thus avoiding shortages in the warehouse and fully satisfying market needs.
-
Intelligent OCR
We can create a tool that automatically recognizes and digitizes documents, based on photos – intelligent OCR tools based on neural networks.
-
Customer Intelligence
Thanks to a better understanding of customers at every stage of their purchasing path, you will better adapt your offer to their needs and engage in more effective marketing and sales activities. Reach sales and margins growth based on customer behaviour analysis.
Goals Achieved
/ with Business Intelligence


Automating Seasonal Analytics for a Premium Fashion Brand
Streamlining analytical processes thanks to Power BI.


Reliable and Scalable Reporting Environment for Production in the Construction Industry
For the market leader in steel pipe culverts and structural elements, we have modernized the reporting environment in Power BI.
The Technologies
/ Behind Solution
Our Experts
/ Knowledge Shared

Multichannel Retail / The Key to Success in the Digital Age
In the era of digital transformation, multichannel retail has become a crucial element of business strategy for companies wishing to maintain their market position and drive growth. For owners of large enterprises considering expansion into new sales channels, especially in the online space, understanding and implementing this concept can prove decisive for...

Magento Pricing / How Much Does It Cost?
Magento 2 is one of the most popular e-commerce platforms worldwide. Thanks to its flexibility, it offers nearly unlimited customization possibilities to suit business needs in both B2C and B2B sectors. There are three versions of the solution available: Magento Open Source, Adobe Commerce, and Adobe Commerce Cloud, each differing in capabilities and...

Magento Multistore / Comprehensive Guide
Multistore, a functionality that enables the management of multiple online stores from a single platform, is becoming a key tool for companies looking to expand their business into various markets. Advanced solutions in this regard are offered by one of the most popular e-commerce platforms on the market – Magento 2. If you plan to create several...


